This equation will change how you see the world (the logistic map)
What this covers
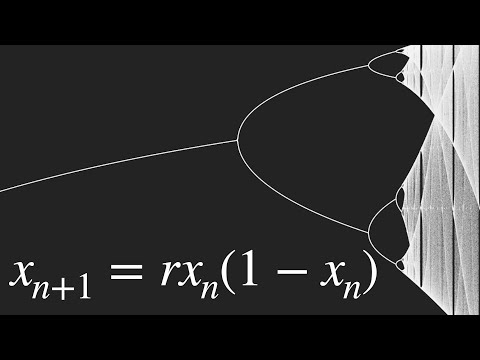
Derek Muller builds the video around a single iterated equation, the logistic map, which he presents as the simplest equation containing a negative feedback loop. Population is treated as a fraction of a theoretical maximum, and the (1−x) term stands in for environmental limits. He begins with low growth rates, where the population settles to an equilibrium regardless of starting value (about 0.615 at R = 2.6). He then raises R and follows the bifurcation diagram as it splits into cycles of 2, 4, 8, 16 and 32 before reaching chaos near R ≈ 3.57. Robert May's 1976 Nature paper is the historical anchor.
The middle of the video looks at what lies inside the chaotic regime. Stable windows reappear there, such as the period-3 cycle near R ≈ 3.83, which has its own doublings to 6, 12 and 24 before chaos returns. Muller also says that a period of any length can be found with the right R, and that the diagram is a fractal, with large-scale features repeating at smaller scales. He then turns to Mitchell Feigenbaum and the ratio of successive bifurcation widths, which converges to 4.669 for any single-hump function. He treats this as a constant that does not reduce to any known one.
The evidence from physical systems is the most varied part. It covers Lieb Taber's mercury convection experiment, dripping faucets that go from regular to paired to chaotic drips, and salamander and human eyes that respond to only every other flicker above a threshold. It also covers rabbit hearts that pass through 2-cycles and 4-cycles into fibrillation, and a chaos-based method of timing shocks to restore normal beating. The last section connects the bifurcation diagram to the Mandelbrot set. The main cardioid, the period-2 bulb and the thin needle correspond to the diagram's regions, and a small medallion in the needle matches the period-3 window.
The logistic map and bifurcation diagram demonstrate how a simple deterministic equation exhibits universal mathematical properties—period doubling, chaos, and the Feigenbaum constant—that appear across disparate physical systems from rabbit populations to fluid convection to neural firing, revealing deep universality in nature.
- The logistic map (xn+1 = R·xn·(1−xn)) is the simplest equation with negative feedback yet produces stability, periodic cycles, and chaos as the growth rate R increases
- Period-doubling bifurcation and the Feigenbaum constant (4.669) appear universally in single-hump iterated functions and in real physical systems (dripping faucets, convecting fluids, rabbit heart fibrillation)
- The bifurcation diagram is geometrically embedded within the Mandelbrot set, connecting discrete dynamical systems to complex fractal geometry
This asset isn't compiled yet
You're seeing its claims, ranked. Compile it to build the argument threads, weight them, and check each claim against your library — the full view.
Using real-time cardiac monitoring, researchers applied chaos theory to determine optimal timing for electrical shocks to return fibrillating rabbit hearts to periodic (normal) beating, successfully converting chaotic arrhythmias using a chaos-based control method.
“what was really cool about this study was they monitored the heart in real time and used chaos theory to determine when to apply electrical shocks to the heart to return it to periodicity and they were able to do that successfully so they used chaos to control a heart and figure out a smarter way to deliver electric shocks to set it beating normally again”
Scientists studying the response of vertebrate eyes (salamander and other eyes) to flickering lights discovered that eyes exhibit period-doubling bifurcation: above a certain flicker rate, eyes only respond to every other flicker, demonstrating bifurcation in sensory biology.
“Scientists have studied the response of our eyes and salamander eyes to flickering lights and what they find is a period doubling that once the light reaches a certain rate of flickering our eyes only respond to every other flicker”
In studies of rabbit heart response to a fibrillation-inducing drug, researchers observed the period-doubling route to chaos: rabbits' hearts began with periodic beating, then entered a 2-cycle (two close beats), then a 4-cycle (four different beats) before descending into chaotic fibrillation.
“in another study scientists gave rabbits a drug that sent their hearts into fibrillation...on the path to fibrillation they found the period doubling route to chaos the rabbits started out with a periodic beat and then it went into a two cycle two beats close together and then a four cycle four different beats before it repeated again and eventually a periodic behavior”
Fluid dynamicist Lieb Taber conducted an experiment with a small rectangular box containing mercury, inducing thermal convection with temperature gradients, observing period-doubling bifurcations in temperature spikes as the gradient increased—providing the first major experimental confirmation of bifurcation theory.
“the first major experimental confirmation came from a fluid dynamicists named Lib Taber he created a small rectangular box with mercury inside and he used a small temperature gradient to induce convection just two counter-rotating cylinders of fluid inside his box...what he saw was a regular spike a periodic spike in the temperature...as he increased the temperature gradient a wobble developed on those rolling cylinders at half the original frequency the spikes in temperature were no longer the same height instead they went back and forth between two different heights he had achieved period two and as he continued to increase the temperature he saw period doubling again”
In studies of eye response to flickering lights, the bifurcation diagram emerges from real-world data in a fuzzy form, showing that the abstract mathematical bifurcation diagram is observable in biological sensory systems.
“it's amazing in these papers to see the bifurcation diagram emerge albeit a bit fuzzy because it comes from real-world data”
Physicist Mitchell Feigenbaum discovered that the ratio of the width of successive bifurcation sections (each bifurcation width divided by the next) converges to a fixed constant: 4.669, now called the Feigenbaum constant, regardless of which single-hump function is iterated.
“there was this physicist Mitchell Feigenbaum who was looking at when the bifurcations occur he divided the width of each bifurcation section by the next one and he found that ratio closed in on this number four point six six nine which is now called the Feigenbaum constant the bifurcations come faster and faster but in a ratio that approaches this fixed value”
Standard pictures of the Mandelbrot set show only the boundary between numbers that remain finite and those that diverge to infinity, but do not visualize the actual iteration behavior; by plotting iterations in a third dimension (z-axis), the bifurcation diagram emerges as a structure within the Mandelbrot set.
“normally when you see pictures of the Mandelbrot set it just shows you the boundary between the numbers that cause this iterated equation to remain finite and those that cause it to blow up but it doesn't really show you how these numbers stay finite so what we've done here is actually iterated that equation thousands of times and then plotted on the z axis the value that that iteration actually takes so if we look from the side what you'll actually see is the bifurcation diagram it is part of this Mandelbrot set”
In 1976, biologist Robert May published a landmark paper in Nature about the logistic map that sparked a revolution in research on chaos and nonlinear dynamics, and the paper has been cited thousands of times.
“in 1976 the biologist Robert May wrote a paper in nature about this very equation it's sparked a revolution and people looking into this stuff I mean that papers been cited thousands of times”
As the growth rate R increases from 1 toward 3, the equilibrium population in the logistic map increases proportionally, but once R passes 3, the bifurcation diagram splits in two and the population oscillates between two distinct values (period-2 cycle) rather than converging to a single equilibrium.
“once our hits 1 the population stabilizes on to a constant value and the higher R is the higher the equilibrium population so far so good but now comes the weird part once our passes three the graph splits in two why what's happening well no matter how many times you iterate the equation it never settles on to a single constant value instead it oscillates back and forth between two values one year the population is higher the next year lower and then the cycle repeats”
Any single-hump iterated function (not just the logistic map) exhibits period-doubling bifurcations, and the ratio of bifurcation widths converges to the same Feigenbaum constant 4.669, demonstrating universal scaling in dynamical systems.
“it doesn't have to be the particular form of the equation I showed you earlier any equation that has a single hump if you iterate it the way that we have so you could use xn plus 1 equals sine X for example if you iterate that one again and again and again you will also see bifurcations not only that but the ratio of when those bifurcations occur will have the same scaling for point six six nine any single hump function iterated will give you that fundamental constant”
As R continues to increase past 3, each bifurcation point splits again, doubling the period from 2 to 4 to 8 to 16 to 32 cycles before the period-doubling bifurcations accumulate and lead to chaos at R ≈ 3.57, where the population never settles and bounces around unpredictably.
“As our continues to increase the fork spreads apart and then each one splits again now instead of oscillating back and forth between two values populations go through a four year cycle before repeating since the length of the cycle or period has doubled these are known as period doubling bifurcation z' and as R increases further there are more period doubling bifurcation z' they come faster and faster leading to cycles of 8 16 32 64 and then at R equals three point five seven chaos the population never settles down at all it bounces around as if at random”
Amid the chaotic regime (R > 3.57), windows of stable periodic behavior emerge, such as at R ≈ 3.83 where a stable period-3 cycle returns, which then undergoes its own period-doubling bifurcations (to periods 6, 12, 24) before returning to chaos.
“you might expect the equation to be chaotic from here on out but as R increases order returns there are these windows of stable periodic behavior amid the chaos for example at R equals 3 point 8 3 there is a stable cycle with a period of 3 years and as R continues to increase it splits into 6 12 24 and so on before returning to chaos”
The logistic map bifurcation diagram contains periods of every length (e.g., 3, 750, 1052, or any other integer) if the correct growth rate R is chosen, reflecting the infinite complexity encoded in the parameter space.
“in fact this one equation contains periods of every length 3750 1052 whatever you like if you just have the right value are”
Numbers in the main cardioid of the Mandelbrot set converge to a single stable fixed point when iterated; numbers in the large bulb to the left oscillate between two values (period-2); further bulbs have periods 4, 8, 16, 32, and so on; and the chaotic region corresponds to the thin 'needle' of the Mandelbrot set.
“what this is showing us is that all of the numbers in the main cardioid they end up stabilizing on to a single constant value but the numbers in this main bulb will they end up oscillating back and forth between two values and in this bulb they end up oscillating between four values they've got a period of four and then eight and then 16 32 and so on and then you hit the chaotic part the chaotic part of the bifurcation diagram happens out here on what's called the needle of the Mandelbrot set”
The bifurcation diagram only exists on the real line (real number R values), but all bulbs in the Mandelbrot set extending off the main cardioid in the complex plane also have periodic cycles (periods 3, 4, 5, etc.), creating 'ghostly images' of periodic orbits in the complex plane.
“the bifurcation diagram only exists on the real line because we only put real numbers into our equation but all of these bulbs off of the main cardioid well they also have periodic cycles of for example 3 or 4 or 5 and so you see these repeated ghostly images if we look in the z axis effectively they're oscillating between these values as well”
A small medallion visible in the Mandelbrot set's 'needle' region looks like a smaller version of the entire Mandelbrot set, which corresponds to the window of period-3 stability in the bifurcation plot, demonstrating the fractal self-similarity of the structure.
“you can see this medallion here that looks like a smaller version of the entire Mandelbrot set well that corresponds to the window of stability in the bifurcation plot with a period of three”
The universality of the Feigenbaum constant and period-doubling bifurcations across different dynamical systems is referred to as 'universality' in physics, indicating something fundamental and universal about the bifurcation process itself.
“why is this well it's referred to as universality because there seems to be something fundamental and very Universal about this process this type of equation and that constant value”
Dripping faucets exhibit complex dynamical behavior: at low flow rates, drips are regular and periodic, but as flow rate increases, period-doubling bifurcations occur (drips come two at a time), and at higher flow rates, completely chaotic dripping emerges.
“there is the issue of the dripping faucet most of us of course think of dripping faucets as very regular periodic objects but a lot of research has gone into finding that once the flow rate increases a little bit you get period doubling so now the drips come two at a time to tip to tip and eventually from a dripping faucet you can get chaotic behavior just by adjusting the flow rate”
The existence of the Feigenbaum constant—a fundamental dimensionless number that does not derive from known physical constants but emerges universally from single-hump iterated functions—reveals deep structure in mathematics and nature that cannot be reduced to more fundamental principles.
“no one knows where this constant comes from it doesn't seem to relate to any other known physical constant so it is itself a fundamental constant of nature”
The Feigenbaum constant 4.669 does not appear to relate to any other known physical or mathematical constant, making it itself a fundamental constant of nature whose origin remains mysterious.
“no one knows where this constant comes from it doesn't seem to relate to any other known physical constant so it is itself a fundamental constant of nature”
The logistic map xn+1 = R·xn·(1−xn) is the simplest equation that has a negative feedback loop, where population is modeled as a fraction (0 to 1) of theoretical maximum, and the term (1−X) represents environmental constraints that prevent exponential growth.
“this is the logistic map xn plus 1 is the population next year and xn is the population this year and if you graph the population next year versus the population this year you see it is just an inverted parabola it's the simplest equation you can make that has a negative feedback loop the bigger the population gets over here the smaller it'll be the following year”
The bifurcation diagram of the logistic map is visually a fractal—its large-scale features repeat on progressively smaller and smaller scales when zoomed in.
“looking at this bifurcation diagram you may notice that it looks like a fractal the large-scale features look to be repeated on smaller and smaller scales and sure enough if you zoom in you see that it is in fact a fractal”
The Mandelbrot set is defined by iterating the equation Z(n+1) = Z(n)² + C starting with Z = 0; a complex number C is in the set if the iteration remains finite after unlimited repetitions, and is not in the set if it diverges to infinity.
“the Mandelbrot set it is based on this iterated equation so the way it works is you pick a number C any number in the complex plane and then start with Z equals 0 and then iterate this equation over and over again if it blows up to infinity well then the number C is not part of the set but if this number remains finite after unlimited iterations well then it is part of the Mandelbrot set”
At R = 2.6 and initial population 0.4, the logistic map rapidly converges to an equilibrium value of approximately 0.615, regardless of initial conditions, demonstrating stable long-term behavior matching observations in wild populations where births and deaths are balanced.
“let's say we're dealing with a particularly active group of rabbits so R equals two point six and then let's pick a starting population of 40% of the maximum so point four and then times 1 minus 0.4 and we get 0.62 four okay so the population increased in the first year but what we're really interested in is the long term behavior of this population...you see that the population doesn't really change it has stabilized which matches what we see in the wild populations often remain the same as long as births and deaths are balanced”
The logistic map equation can be used to generate pseudo-random numbers on computers because, despite being deterministic, it produces chaotic output that appears random—though it is only pseudo-random because exact initial conditions allow exact prediction.
“this equation provided one of the first methods of generating random numbers on computers it was a way to get something unpredictable from a deterministic machine there is no pattern here no repeating of course if you did know the exact initial conditions you could calculate the values exactly so they are considered only pseudo-random numbers”
Robert May argued in his 1976 Nature paper that students should be taught about the logistic map because it provides new intuition for how simple equations can generate very complex behaviors, yet this is still not standard in educational curricula.
“in the paper he makes this plea that we should teach students about this simple equation because it gives you a new intuition for ways in which simple things simple equations can create very complex behaviors and I still think that today we don't really teach this way I mean we teach simple equations and simple outcomes because those are the easy things to do and those are the things that make sense we're not gonna throw chaos at students but maybe we should maybe we should throw at least a little bit”
Dripping faucets are a simple chaotic system accessible to anyone: by opening a tap slightly and adjusting the flow rate, one can experimentally observe transitions from periodic dripping to bifurcation to chaos without special equipment.
“this is a really easy chaotic system you can experiment with at home go open a tap just a little bit and see if you can get a periodic dripping in your house”
The fact that the bifurcation diagram appears in so many disparate systems—fluid convection, sensory neurobiology, cardiac arrhythmias, and fluid dynamics of dripping faucets—suggests something fundamentally spooky or mysterious about the universality of this mathematical structure in nature.
“the bifurcation diagram pops up in so many different places that it starts to feel spooky and I want to tell you something that'll make it seem even spookier”
Testing C = −1 in the Mandelbrot set equation yields 0² − 1 = −1, (−1)² − 1 = 0, 0² − 1 = −1, oscillating between −1 and 0, so the iteration remains finite and C = −1 is in the Mandelbrot set.
“what if we try C equals negative 1 well then we've got 0 squared minus 1 equals negative 1 negative 1 squared minus 1 equals 0 and so we're back to 0 squared minus 1 equals negative 1 so we see that this function is going to keep oscillating back and forth between negative 1 and 0 and so it'll remain finite and so C equals negative 1 is part of the Mandelbrot set”
Testing C = 1 in the Mandelbrot set equation Z(n+1) = Z(n)² + C yields 0² + 1 = 1, 1² + 1 = 2, 2² + 1 = 5, 5² + 1 = 26, demonstrating rapid divergence to infinity, so C = 1 is not in the Mandelbrot set.
“let's try for example C equals 1 so we've got 0 squared plus 1 equals 1 then 1 squared plus 1 equals 2 2 squared plus 1 equals 5 5 squared plus 1 equals 26 so pretty quickly you can see that with C equals 1 this equation is going to blow up so the number 1 is not part of the Mandelbrot set”
Taber's mercury convection experiment was beautifully crafted and provided spectacular confirmation of bifurcation theory by showing period-doubling as temperature increased, marking a major early experimental validation of the theory.
“this was a pretty spectacular confirmation of the theory in a beautifully crafted experiment but this was only the beginning”
The speaker (Derek Muller) has been excited about chaos theory and wanted to make videos on this topic since reading James Gleick's book 'Chaos', and is only now finally getting the chance to do so.
“since I read James Gleick's book chaos I have wanted to make videos on this topic and now I'm finally getting around to it”